Break any KPI into a slide‑ready graph tree.

Paste a table from Excel. Graph Tree builds the tree, checks that the numbers add up and exports it for your presentation.

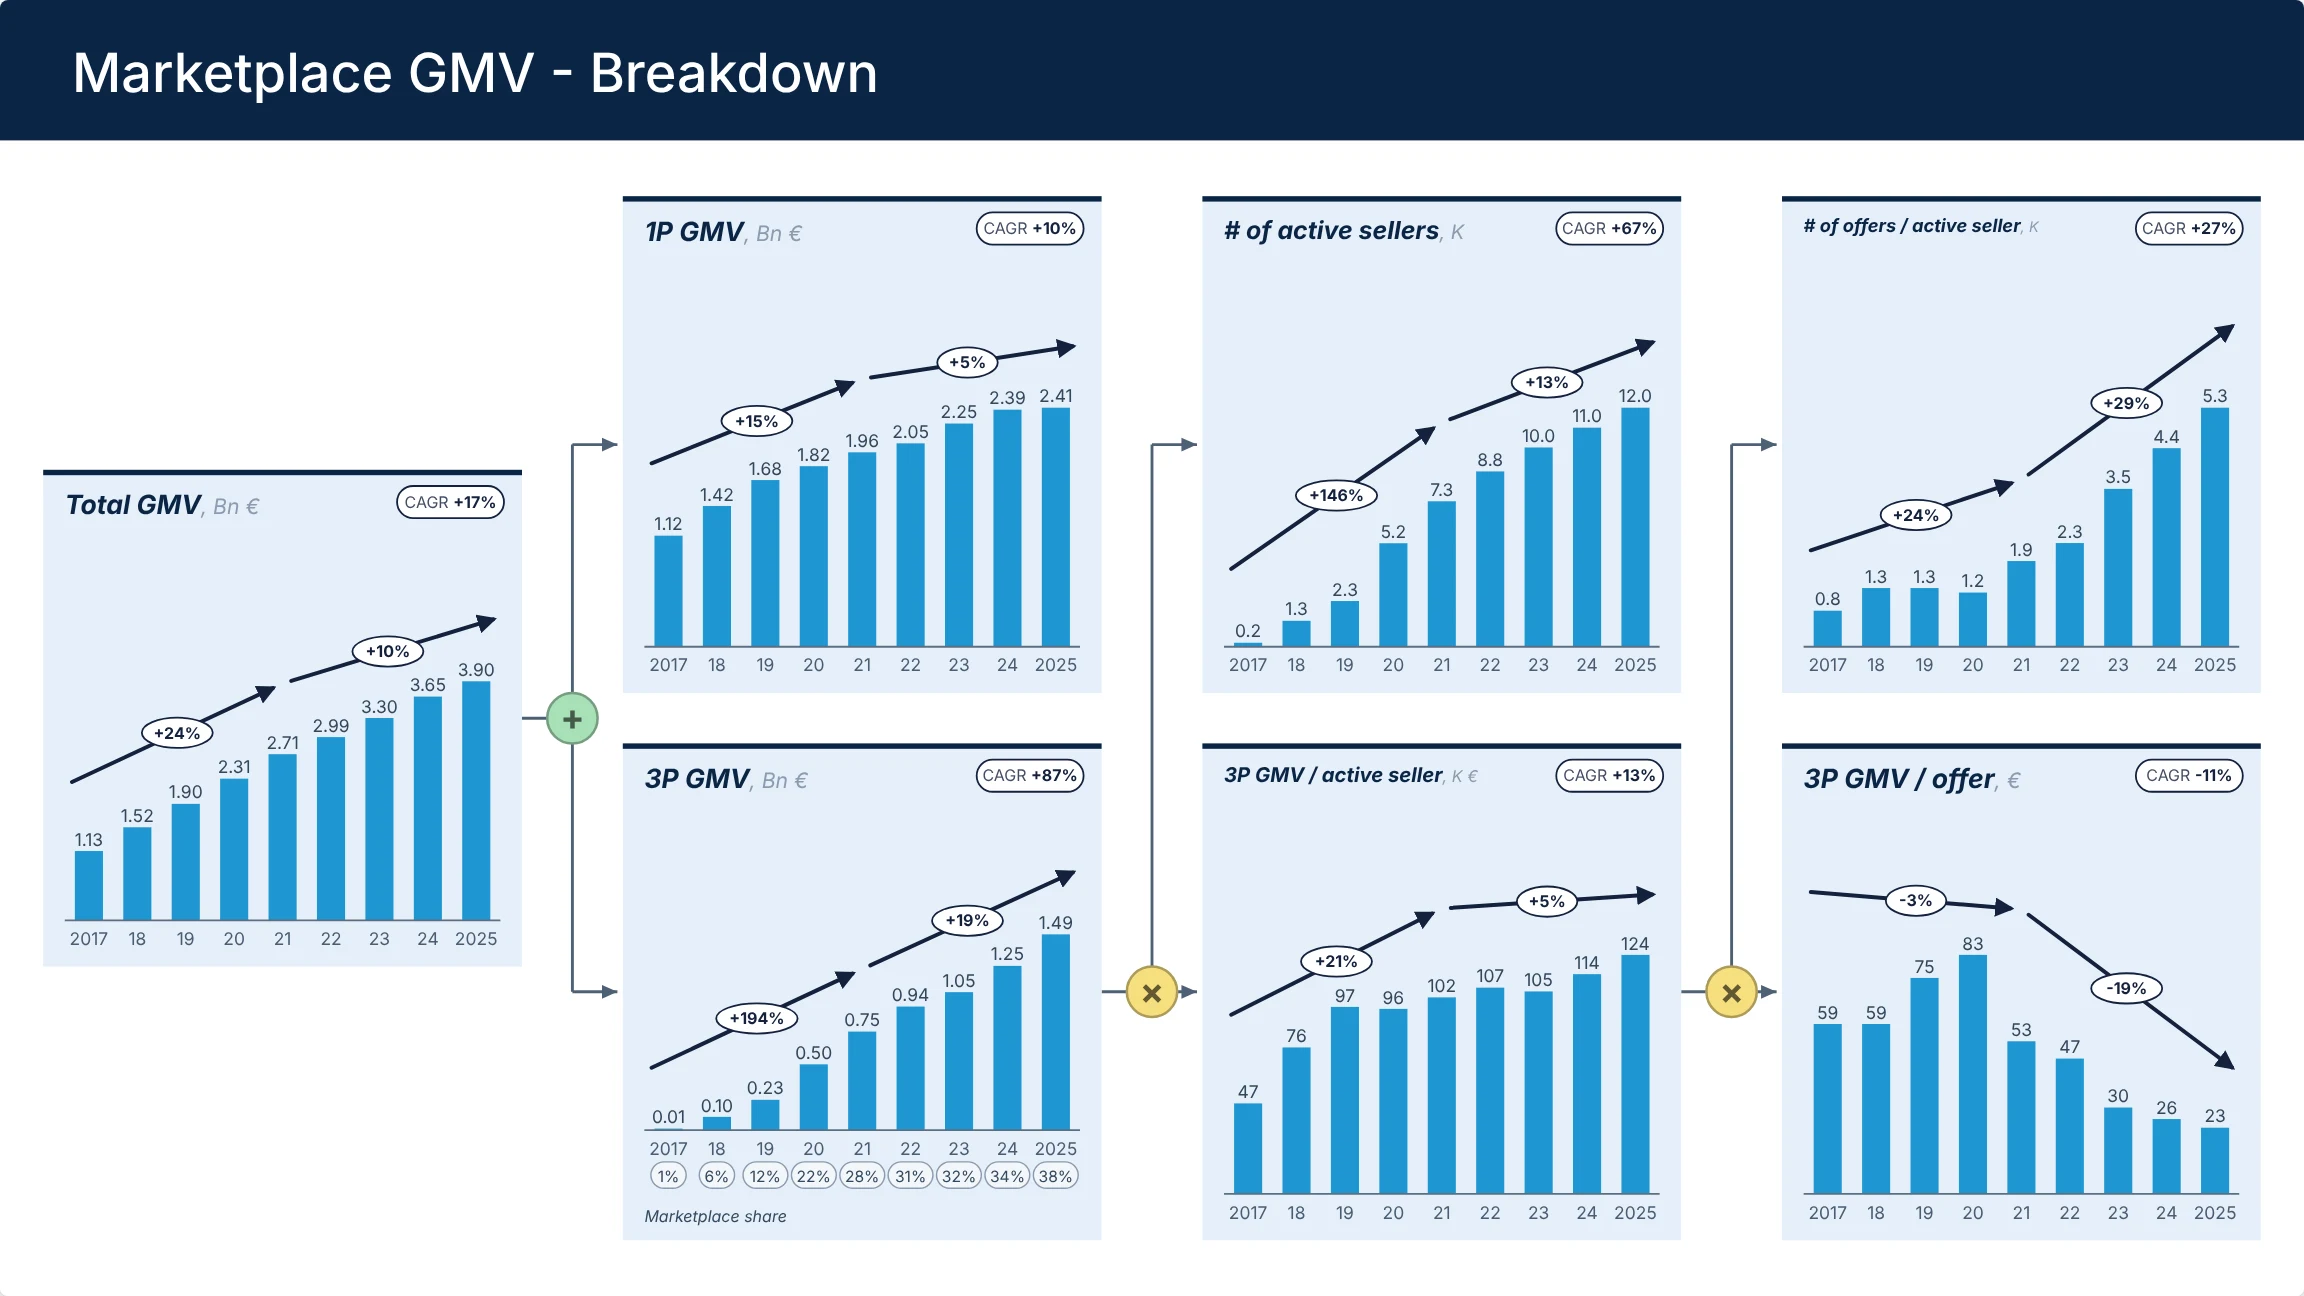
GMV = 1P + 3P · 3P = sellers × GMV / seller

Marketplace GMV - Breakdown Total GMV, Bn € CAGR +14% 2.31 2021 2.71 22 2.99 23 3.30 24 3.90 2025 + 1P GMV, Bn € CAGR +7% 1.82 2021 1.96 22 2.05 23 2.25 24 2.41 2025 3P GMV, Bn € CAGR +31% 0.50 2021 0.75 22 0.94 23 1.05 24 1.49 2025 × # of active sellers, K CAGR +23% 5.2 2021 7.3 22 8.8 23 10.0 24 12.0 2025 3P GMV / active seller, K € CAGR +7% 96 2021 102 22 107 23 105 24 124 2025

What is it

Understand the link between your KPIs in a visual way

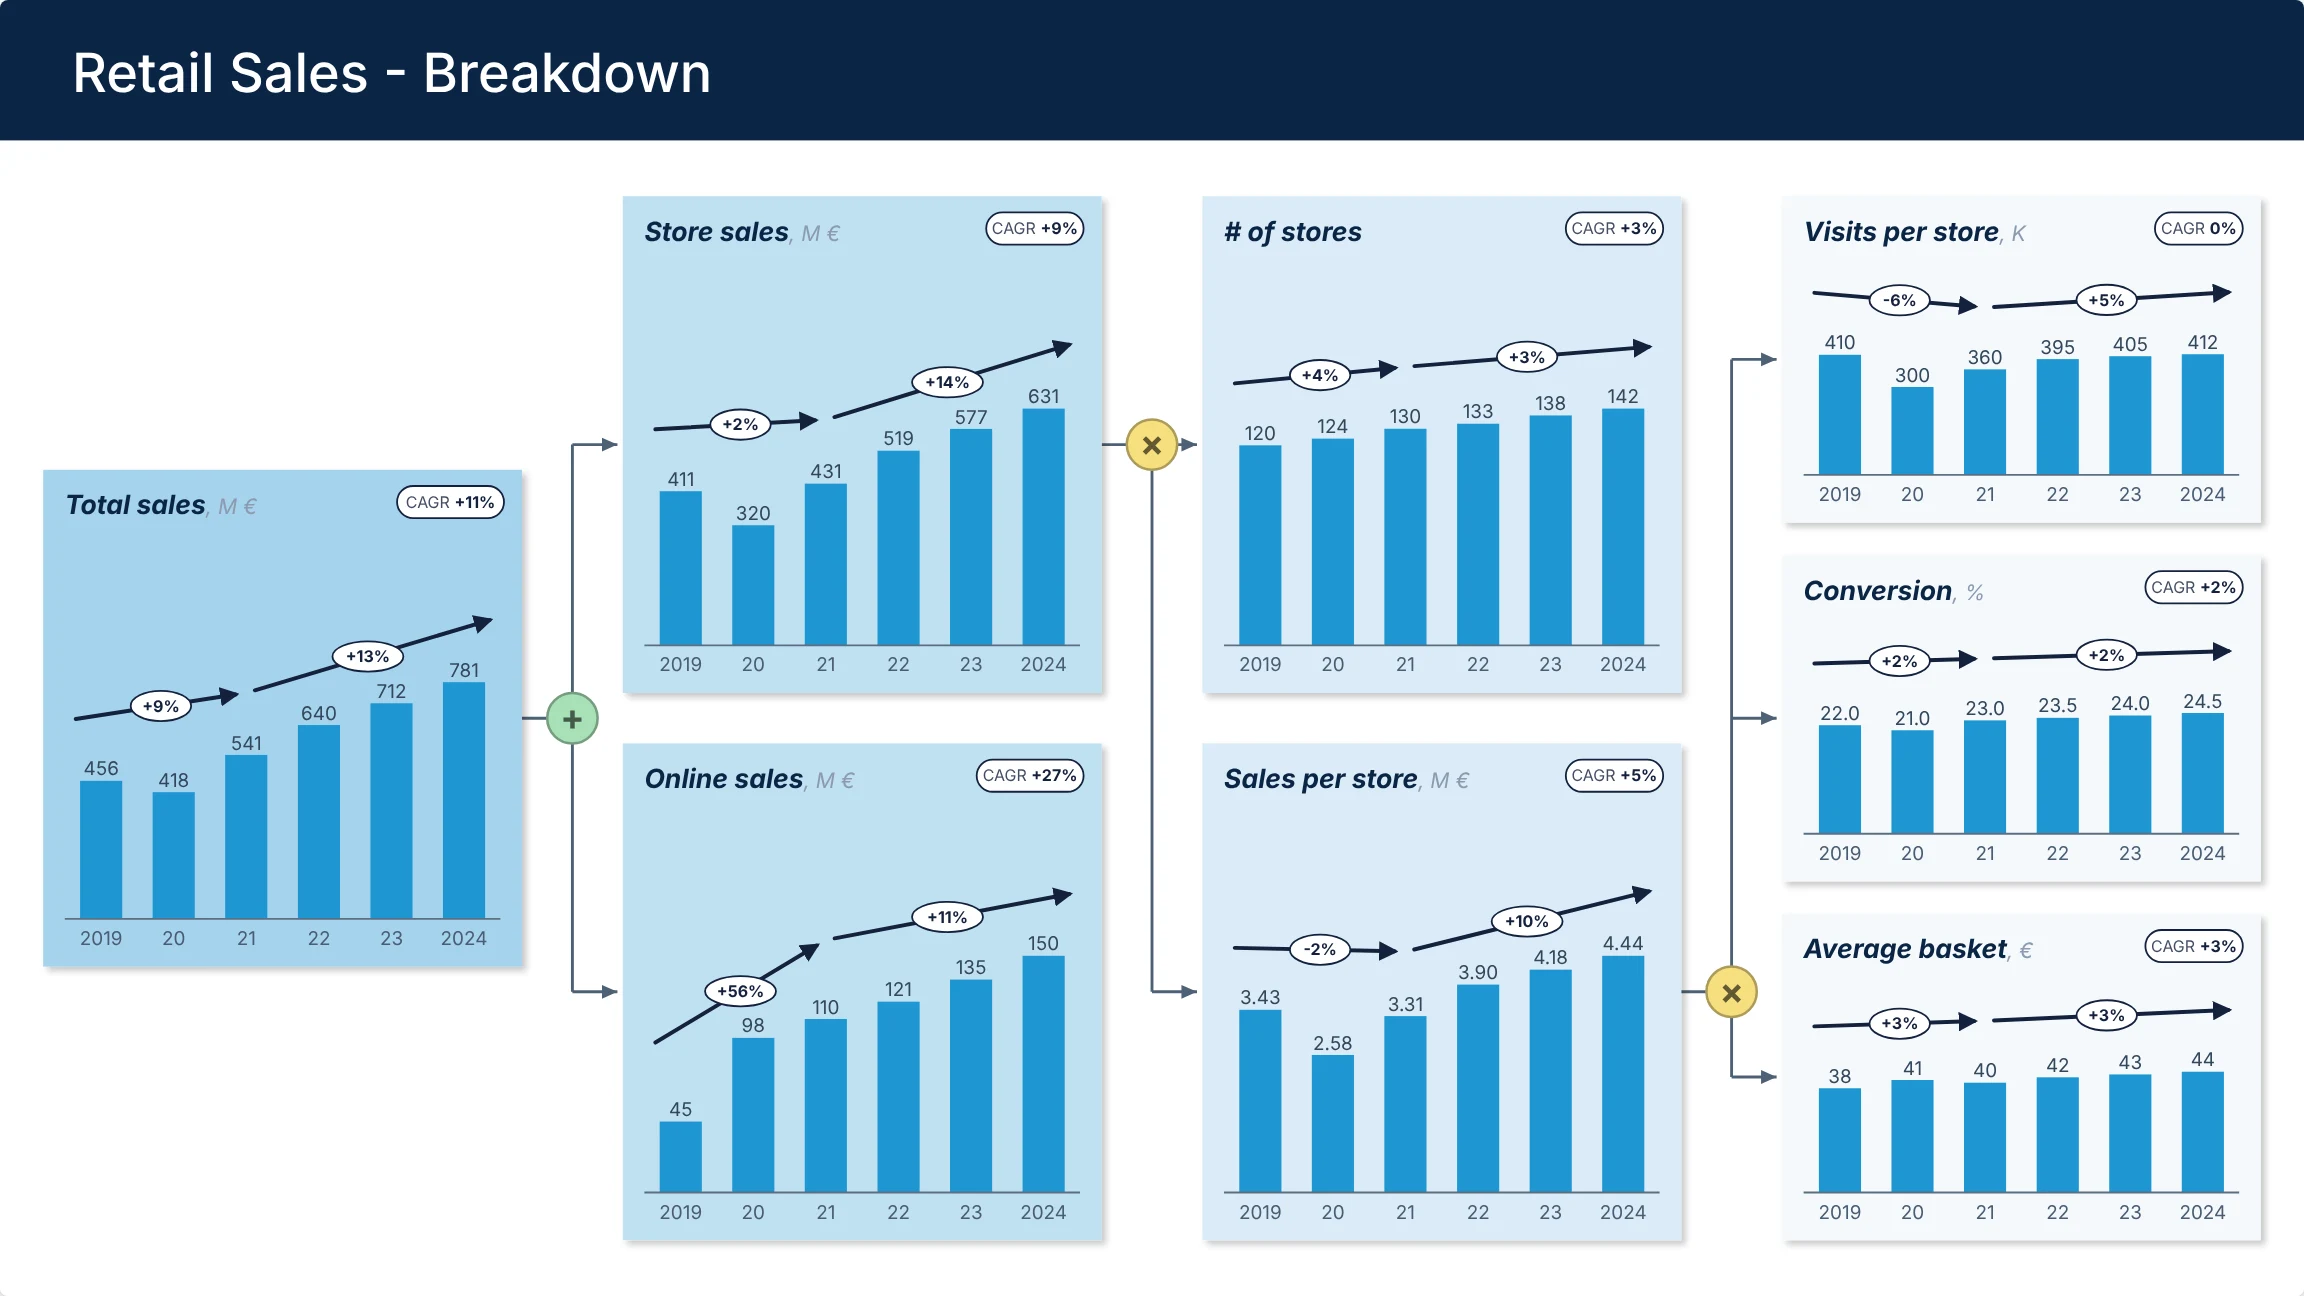
Retail Sales - Breakdown +××CAGR +11%Total sales, M €4564185416407127812019202122232024+9%+13%CAGR +9%Store sales, M €4113204315195776312019202122232024+2%+14%CAGR +3%# of stores1201241301331381422019202122232024+4%+3%CAGR +5%Sales per store, M €3.432.583.313.904.184.442019202122232024-2%+10%CAGR 0%Visits per store, K4103003603954054122019202122232024-6%+5%CAGR +2%Conversion, %22.021.023.023.524.024.52019202122232024+2%+2%CAGR +3%Average basket, €3841404243442019202122232024+3%+3%CAGR +27%Online sales, M €45981101211351502019202122232024+56%+11%POWERPOINT SLIDE
Infinite Canva
Retail Sales - Breakdown +××CAGR +11%Total sales, M €4564185416407127812019202122232024+9%+13%CAGR +9%Store sales, M €4113204315195776312019202122232024+2%+14%CAGR +3%# of stores1201241301331381422019202122232024+4%+3%CAGR +5%Sales per store, M €3.432.583.313.904.184.442019202122232024-2%+10%CAGR 0%Visits per store, K4103003603954054122019202122232024-6%+5%CAGR +2%Conversion, %22.021.023.023.524.024.52019202122232024+2%+2%CAGR +3%Average basket, €3841404243442019202122232024+3%+3%CAGR +27%Online sales, M €45981101211351502019202122232024+56%+11%LINEARLOG
  • Create in less than 1 min

    Paste a table from Excel, the tree is built for you.

  • Display CAGR automatically

    Growth bubbles and lines on every box.

  • Automatic sanity checks

    Every year is checked: the drivers must add up.

  • Infinite Canva

    No size limit when a slide is too small.

  • Export in one click

    High-resolution PNG or editable PowerPoint.

How it works

From a spreadsheet to a slide in three steps

STEP 1

Paste your table

Copy a block from Excel or Google Sheets: years across, metrics down. Indent drivers under their parent, or let the tool find which rows add up.

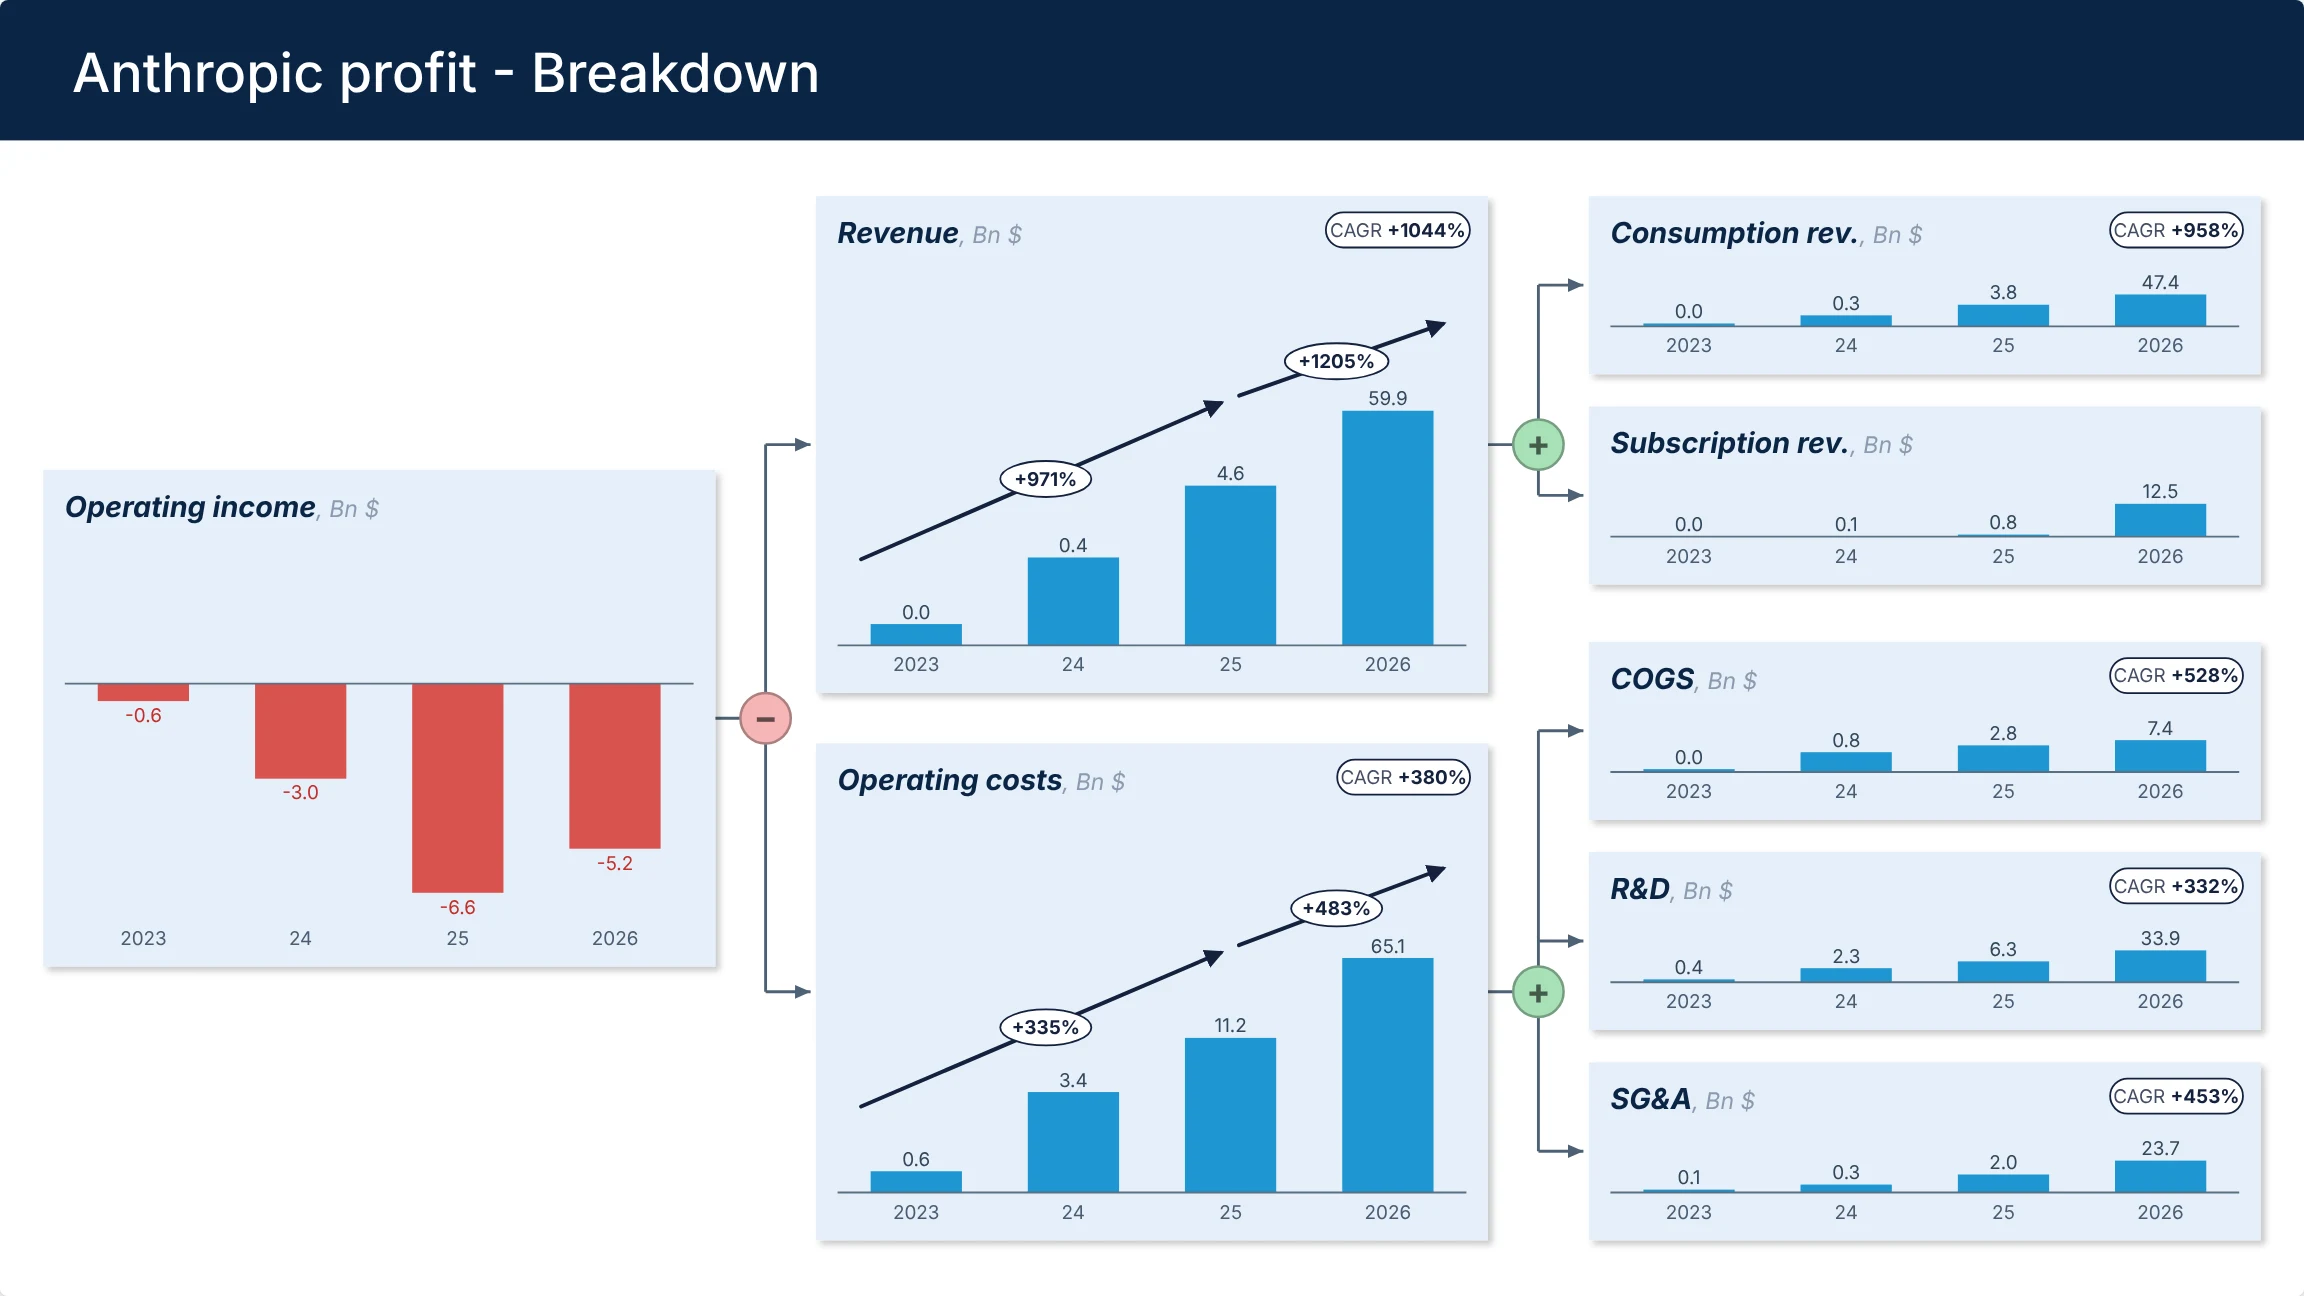
Bn $202420252026
Operating income−3.0−6.6−5.2
  Revenue0.44.659.9
  Operating costs3.411.265.1

STEP 2

Review and customize the tree

Graph Tree detects the formulas, estimates missing values and flags any year where the drivers don't match the total.

✓ Operating income = Revenue − Costs
✓ Revenue = Consumption + Subscription
! Costs ≠ COGS + R&D + SG&A in 2025

STEP 3

Export to presentation

Download the graph tree as a high resolution PNG or an editable PowerPoint. For maximum fidelity, PNG format is preferable.

PNG
Retail Sales - Breakdown.png
High resolution · recommended
PPTX
Retail Sales - Breakdown.pptx
Editable PowerPoint

Examples

Get inspired by ready-made trees

Video tutorial

See a full tree built in two minutes

0:00Paste a table 0:30Fix the structure 1:00Style the slide 1:30Export to presentation

FAQ

Questions before you start

Do I need to install anything?

No. Graph Tree runs in your browser. Open the studio, paste your table and the tree is built on the spot.

Where is my data stored?

In your own browser. The tables you paste and the trees you build are not uploaded to our servers. We only store your account (name and email) and your plan.

Can I edit the slide in PowerPoint?

Yes. The PowerPoint export uses native PowerPoint charts, text boxes and shapes. Change a number in the chart data and the bar follows.

What can I do without paying?

You can open every example, change the formatting (colours, CAGR, log scale, decimals, infinite canvas) and export the examples. Using your own data, saving trees and exporting them requires Pro.

Is Pro a subscription?

The monthly and yearly plans are subscriptions that renew automatically. You can cancel anytime in one click and keep access until the end of the period you paid for. For a one-off project, the day and week passes are single payments that don't renew.

Will I get an invoice?

Yes. Payments go through our payment provider, which emails you a receipt and lets you download an invoice with your company details and VAT number.

What if my numbers don't add up?

Graph Tree checks every split, year by year, and flags any year where the drivers don't match the total. Missing values are estimated from the tree and shown as hatched bars.
Your next performance review deserves a better slide.

Free to try with the examples. No install.

Build your graph tree